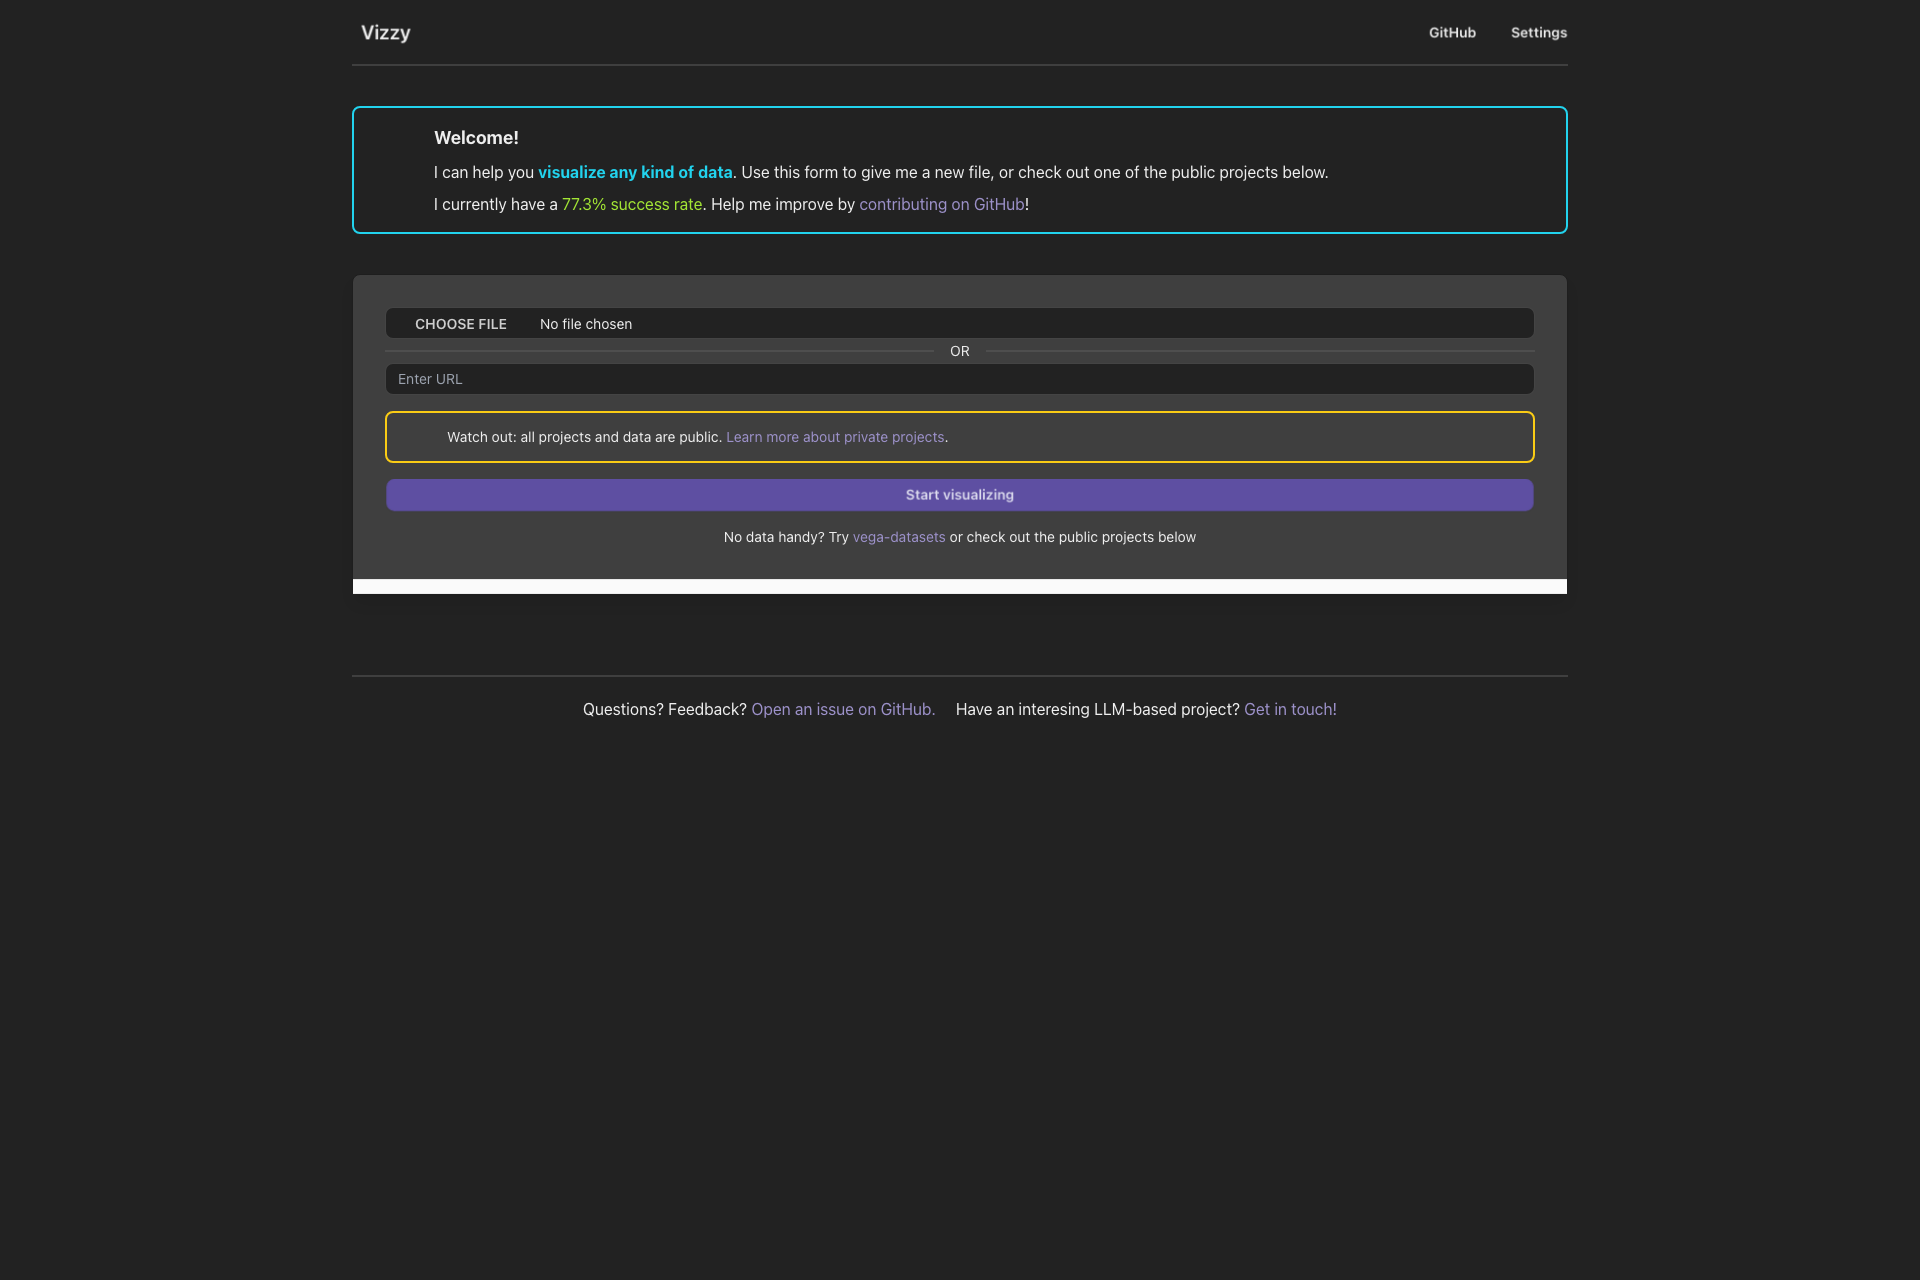
Vizzy Introduction
Vizzy is a powerful tool designed to help users visualize any kind of data. With a simple interface and easy-to-use features, it allows users to create visual representations of their data, making it easier to understand and analyze. Whether you're a data scientist, a business professional, or simply someone who needs to make sense of complex data, Vizzy can help. With a current success rate of 77.3%, Vizzy is continuously improving, thanks to contributions from the community on GitHub.
Vizzy Features
Interactive Data Visualization
One of the key features of Vizzy is its ability to transform your data into interactive visualizations. This allows you to explore your data from different angles and gain deeper insights.
User-Friendly Interface
Vizzy is designed with the user in mind. Its intuitive interface makes it easy for anyone to upload their data and create visualizations without any technical expertise.
Public Project Gallery
Vizzy offers a public project gallery where you can find a variety of interesting visualizations. This is a great resource to explore and get inspired by the work of others.
Example Projects
- Scripts from TV's 'The Office': This project contains lines and information from the popular TV show, providing a fun and unique way to visualize data.
- Same-sex Marriage Legislation Over Time: This project tracks changes in same-sex marriage legislation status across several years in various U.S. states.
- U.S. State Obesity Rates: This project contains data on obesity rates, shape length, and shape area for each U.S. state.
- Cause of Death News Coverage: This project represents the relative frequency of different causes of death, as reported by the CDC, and how often those causes are mentioned in various news sources.
- U.S. National Parks: This project contains information about various national parks in the United States, including geographic details, activities, contacts, and more.
Vizzy Use Cases
Education
Vizzy can be a valuable tool in educational settings, allowing students and teachers to visualize complex data and concepts in a more accessible way.
Business
For businesses, Vizzy can help in making data-driven decisions by providing clear and insightful visualizations of sales, market trends, and customer behavior.
Research
Researchers can benefit from Vizzy by visualizing their data, which can lead to new discoveries and a deeper understanding of their research subjects.
Vizzy FAQs
How do I get started with Vizzy?
To get started with Vizzy, simply visit the website and upload your data file. Vizzy will then guide you through the process of creating your visualization.
What kind of data files does Vizzy support?
Vizzy supports a wide range of data file formats, including CSV, Excel, and JSON, ensuring compatibility with various data sources.
Can I share my visualizations with others?
Yes, you can share your Vizzy visualizations with others by copying the link to your project or by embedding the visualization into your own website or presentation.
Is Vizzy free to use?
Yes, Vizzy is completely free to use. However, certain advanced features may require a premium subscription in the future.
How can I contribute to Vizzy's development?
If you're interested in contributing to Vizzy's development, you can do so by visiting the project's GitHub page and following the instructions provided there.
Conclusion
Vizzy is a versatile and powerful tool for data visualization that can cater to the needs of various users, from students to business professionals. With its user-friendly interface and a wide range of features, Vizzy makes it easy to transform complex data into meaningful insights.